How do we know which stock is cheap or expensive? Are the share of a company that sells at $100 per share really more expensive than the company’s share that sell at $1 per share? The P/E Ratio is another tool that tells us whether a stock is cheap or expensive in relation to a company’s profitability.
Some newbies prefer to buy share of companies at a few dollars price per share because they think these are cheap.
For example, we have $100,000 in capital and there are two company share for us to select.
Company A share price = $1 per share, if we buy them we will get 100,000 shares. And in another case, Company B share price = $100 per share. If we buy them, we can only buy a maximum of 1,000 shares.
Many people think that Company A share price might be cheaper than Company B but actually it might not true. Because the share price is just a number that is determined by a form of financial calculation. The company can set them in unit of ten, or hundreds when first traded in the stock exchange, and it does not indicate that the company is worthy of the given share price.
So how do we know whether the stock is cheap or expensive, is it worth buying?
For those who have been investing in stock market for a while, they may be able to answer that question, they may suggest us to checking the P/E Ratio of that stock, which some textbooks suggest to choose stock with a P/E value of not more than 10 times of current stock price. Anyway, there are exceptions which will be explained further
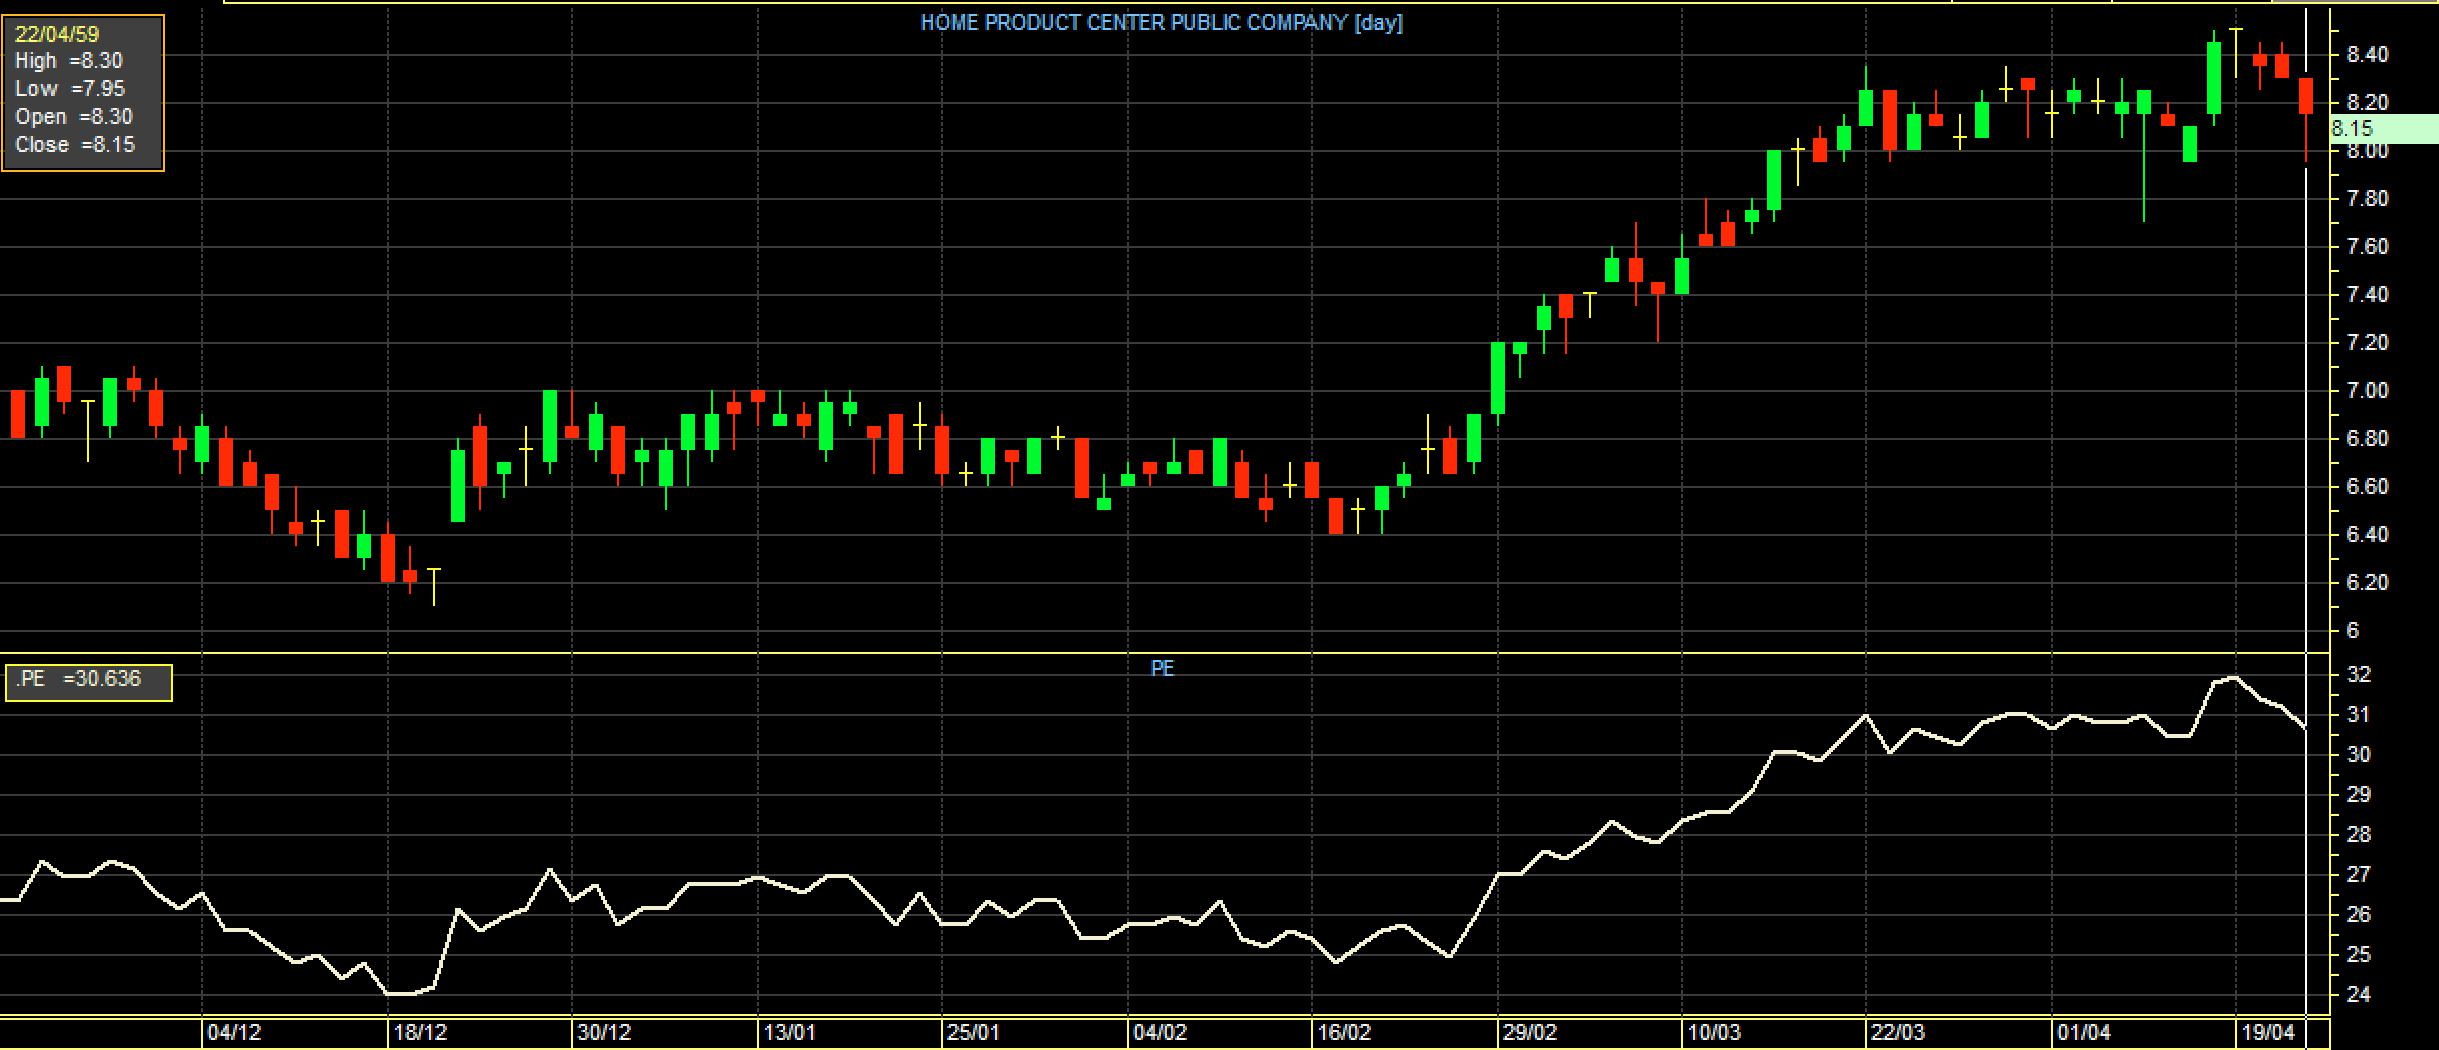
You can find ready-made P/E values from stock trading website or platform which show the current and past P/E values over the years. Below is an example of a price and P/E graph of the Stock Exchange of Thailand. The white line shows the P/E value (we can calculate P/E value for individual stock as well as market index)
What is P/E Ratio and how to calculate
P/E Ratio stands for “Price to Earnings Ratio” (closing price per net profit). The way a company’s P/E is calculated is to divide the current closing share price by one-year earnings per share (EPS) or use the last 4 quarters.
For example, Company A has earnings per share $0.10 over the past one year, and the current share price is trading at $1. So we take $1 share price divided by $0.10 and the result is P/E Ratio equal to 10 or in other cases, Company B has earnings per share in the past one year as $20 and the current share price is trading at $100, so the P/E Ratio = 5 (100 divided by 20). If you compare the P/E of both companies, you will see that stock price of Company B is cheaper than Company A. Because the Company B stock price is trading at 5 times earnings, while the price of Company A stock is trading at 10 times earnings. Imagine, if we buy a company B and the company make the same profit every year $20 per year for 5 consecutive years, it means that we will get the capital back within 5 years while Company A takes 10 years to pay back. Anyway, in the real world situations, many companies may not be able to maintain similar profits every year. Some companies may have their profits decrease in some years or some companies may have consistent profit growth every year (but we can not calculate P/E ratio if the company have not make profit on that year and some websites or trading platform will show the P/E value as 0 or N.A.) In addition to P/E ratio, there is other factor to consider when buying stock as well such as the company doing business in the uptrend or downtrend industry? And when comparing stock of two (or more) company, those company should stay in the same industry.
The P/E described above is based on historical earnings, known as Trailing P/E, but there is another calculation based on forecast earnings in the future called Forward P/E. For example, suppose that the executives of Company B gave an interview on December 30, 2021 that the company’s profits in the next year for the whole year 2022 should grow more than the year 2021 about 10%. Because the company has expanded its branches to other countries and will begin to recognize additional revenues in the next year. If the past year 2021 the company has made a profit of $20 per share, in 2022 the profit should be increased to $22 per share (if profit in 2022 increase by 10%) Assuming that the share price is now trading at $100, the Forward P/E is 4.54 (100 divided by 22). The future forecast may be inaccurate, therefore if using Foward P/E, it is better to use with stocks that has relatively consistent growth or if the company has a good story or plans to support the expected growth. And we may need to study the forecast report issued by many securities analysts as well before make decision to buy any stock.